Namely Analytics: Headcount Dashboard
Monitor trends in your employee population with the Headcount dashboard. This dashboard is a point-in-time display of your organization’s:
-
Total employee count
-
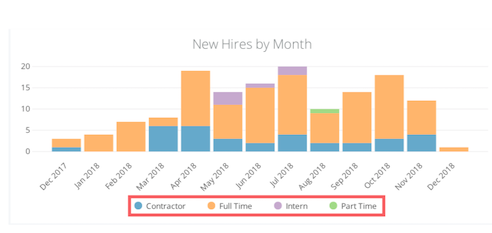
New hires by month
-
Average employee tenure
-
Headcount by year
-
Headcount by year and gender
Filter by department, division, or location, or pick a point in time to review headcount on that date.
For more information on using Namely Analytics dashboards, including how to select filters and download reports, see Namely Analytics.
Filter by Employee Type
The New Hires by Month, Headcount by Year, and Headcount by Year and Gender charts can be filtered by employee type.
Click the employee type filters to display data for specific employee types.

Data Table

The following fields in the Headcount data table are based on Effective Date:
-
Start Date
-
Termination Date
-
Department
-
Division
-
Office Location
-
Gender
-
Ethnicity
As such, rehires will not be represented in the data table, even in the point-in-time look backs.